Thursday, July 17, 2008

Starplot


A Starplot allows the user to easily visualize and compare multiple variables across observations. Each observation is shown as a star shape, with each ray representing a variable. The variables are plotted on the radii, which represents different characteristics. The length of the ray is related to the size of the variable. The resulting shape of the starplot is then compared to the shape of other starplots formed from separate observations, which are easiest to compare when all of the variables have their scales aligned in the same direction, so that increasing and decreasing values represent the same measure. This starplot shows a number of variables relating to automobiles. Each starplot is a different car model. Each ray is a variable such as price, mpg, headroom, trunk space, etc.

Tuesday, July 15, 2008

Correlation Matrix


A Correlation Matrix is a statistical visualization that organizes pairs of variables by correlation. Correlation is the strength of the relationship between the two variables. When it is necessary to examine the correlation between more than one pair of variables in a single analysis, a correlation matrix is often utilized. The correlation matrix shows all possible paired correlations symmetrically. This correlation matrix represents the relationships between various investment markets to assist investors diversify by highlighting highly correlated funds.

Saturday, July 12, 2008

Similarity Matrix


A Similarity Matrix shows how similar two variables are along a scale. They are often used in genetic visualizations. The matrix often is a square made up of a series of smaller squares, with the color of the square indicating the level of similarity between the data points. The diagram shown above is a differential expression signature similarity matrix from a study on gene expression profiling of long-lived dwarf mice that compares longevity-associated genes and relationships with diet, gender and aging. Dark red colors indicate high similarity, pairs with non-significant similarity have no coloring.

Monday, July 7, 2008

Stem and Leaf Plot


A Stem and Leaf Plot is designed to show the shape and distribution of data. It is similar to a histogram placed on its side but in addition to showing the frequency of the intervals with the stem, it gives the individual values within the interval. The leaf of each data value in a stem and leaf plot is determined by the digit that is furthest to the right. The digits to the left of this leaf are the stem. This simple stem and leaf plot shows distribution of weight and was generated by the statistical software program Minitab.

Sunday, July 6, 2008

Box Plot


A Box Plot, or Box and Whisker Diagram, is a summarizing visualization used to show the median, upper quartile, lower quartile, smallest observation and largest observation of statistical data, and sometimes indicates outliers with a point. The box plot was created by John Tukey. Box plots are frequently used to compare multiple data sets, and are oriented either horizontally or vertically. This vertical Box Plot compares employee salary across grades by gender, the blue symbols representing men and the red women in 2004. This diagram allows the user to see that the median salary is lower for women at all grade levels, but widens significantly as higher levels are achieved.

Saturday, July 5, 2008

Histogram


A Histogram is a type of graphic visualization that uses vertical bars to represent tabulated frequencies. The bars which represent categories are adjacent and the area of the bar represents the value of the category, as opposed to the height of the bar in a true bar graph. The area of each bar is proportional to the frequency of the corresponding interval. When the class intervals are of equal size the height of each bar is proportional to the frequency. The shape of the graph describes how the categories are distributed about the mean and they allow the graph user to analyze large datasets on a single graph by showing the primary, secondary and tertiary peaks along with a visual representation of the peaks’ statistical significance. It is often necessary to condense the data into ranges or classes defined by intervals, as in the example above. This histogram shows the frequency distribution of the liveweights of 150 chickens selected randomly from a market.

Friday, July 4, 2008

Parallel Coordinate Graph


In a Parallel Coordinate Graph each of the variables is plotted on a vertical axis, and a data element is connected by a series of points on each axis. Parallel coordinate plots are a kind of visualization that is used to analyze relationships and correlations between multiple variables. The parallel coordinate graph above plots genes that fit a model of the heat shock gene from a study on a biological microarray data set of gene expression levels. The lines are the ribosomal protein genes plotted on vertical axes that record the log ratio of expression for each experiment.

Thursday, July 3, 2008

Triangular Plot


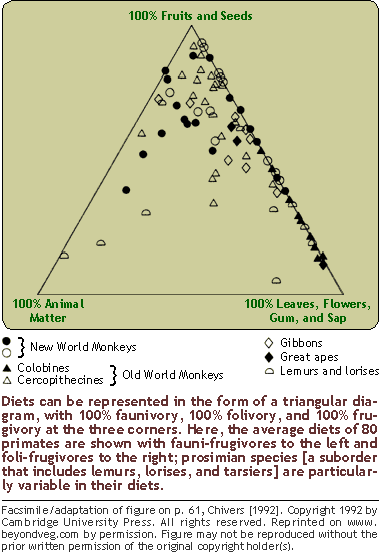
A Triangular Plot Diagram plots three values on triangular axes. The corners of the triangle represent 100% of the corresponding value. Points on the line opposite an angle have none of the value. All combinations of two values lie on an edge of the triangle. The closer a point is to a corner the more of the value exists. Triangular plots are good visualizations for representing compositions made up of varying amounts of three substances. The accompanying Triangular Plot Diagram shows the average diets of 80 primates composed of the three food classes: fruits and seeds; leaves, flowers, gum, and sap; and animal matter. One can see that new world monkeys have a diet higher in fruits and seeds than do the Colombines, whose diet is higher in leaves and other vegetable matter.

Wednesday, July 2, 2008

Windrose


A Windrose is a circular graph that plots wind speed and wind direction over a specific period of time. Windroses can contain up to three wind direction elements: the prevailing wind direction, the prevailing energy direction and the average turbulence intensity. This Windrose is for Scottsbluff, NE from 1996 through 2005, showing that the prevailing winds come mainly from the NW and SE.

Tuesday, July 1, 2008

Climograph


A Climograph shows the relation between monthly temperature and precipitation for a specified area over a period of time, usually a year. It combines two graph types, bar and line, with the bar graph portion showing how much precipitation occurred and the line graph showing the temperature for the same place during the same time period. The accompanying climograph graphically represents the relationship between temperature and precipitation for Miami, FL over a one year span.

Monday, June 30, 2008

Population Profile


A Population Profile, or Population Pyramid, shows sex and age distributions for a determined area, such as a country or region, at a specific period of time. These graphs are useful in understanding the demographic transition of a geographical area. Thin patterns show low fertility, thick patterns show high fertility. A thin column with a bulbous top shows below replacement level fertility. A significant imbalance between the two sides which indicate sex of population may indicate war, in which there is a reduction of men, or infanticide of girls in places like China where there is strict population control along with a desire for male offspring. The pyramid above is for Ethiopia in 2005. The rapidly diminishing pyramid indicates both a high fertility and mortality rate for this country.

Sunday, June 29, 2008

Scatterplot


A Scatterplot uses Cartesian coordinates to graph two variables for a data set. The data is graphed using points, the independent variable plotted along the horizontal axis and the dependent variable along the vertical axis. This kind of visualization is useful for examining correlations. When both variables increase, there is a positive relationship and when one increases and the other decreases, there is a negative one. A line is sometimes included on a scatterplot to indicate the trend of the data, a close fit between this trend line and the points indicates a correlation. This scatterplot plots the FIFA ranking of national soccer teams against their respective countries GNP per capita.

Index Value Plot


An Index Value Plot is a geovisualization that plots an index value rather than an absolute number. An index value is determined and then the values for subsequent periods are divided by the initial average and multiplied by 100, so that all of the plots values are relative to the index value. A common index used in economics is the market basket known as the basket of consumer goods, used to define the Consumer Price Index. The accompanying index value plot indexes home values using a benchmark value from 1890 and factoring out inflation. It shows the high of the housing value boom in the early years of the 21st century.

Saturday, June 28, 2008

Accululated Line Graph (Lorenz Curve)


An Accumulated Line Graph or Lorenz Curve is a type of geovisualization that graphically represents cumulative distribution. It is frequently used in economics to show inequality in wealth or size. It is made by plotting the cumulative distribution of the variable against the cumulative frequency distribution of the individuals that possess the variable. This Accumulation plot is the Lorenz curve for Household Income and Expenditures in the years 2002-2003 for the Maldives, an island nation in the Indian Ocean.


Thursday, June 26, 2008

Bilateral Graph


Graphs can be Bilateral, based upon two data series, in order to compare two related variables. Bilateral Graphs can be of varying types, including bar and line. Often in bilateral bar graphs one data series is measured up or to the right, while the other is measured downwards or to the left. Bilateral graphs can show negative and are frequently used to represent how an increase in one data series cause either a decline in another or an accompanying rise. The bilateral line graph above shows the relationship between gas prices and consumer spending in the US for most of 2007.

Tuesday, June 24, 2008

Nominal Area Choropleth


Nominal Area Choropleth maps use a qualitative classification which has no implicit ordering to represent data by category. This nominal area choropleth uses colors to represent qualitatively the geologic periods of the US.

Monday, June 23, 2008

Unstandardized Choropleth Map


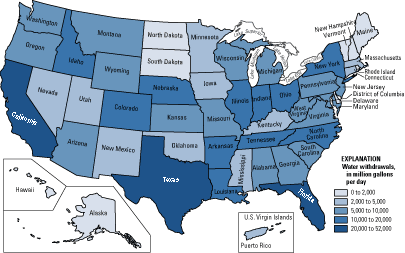
Unstandardized Choropleths portray areal data without averaging within specified units. The data is presented as a total value. The map above is shows total water use per day by state in the US.

Standardized Choropleth Map

A Standardized Choropleth map is on that has been areally averaged, that is one in which the numerical data has been standardized to a specific unit, such as population per square mile or percentage per a unit of area. Standardized Choropleths are useful because the allow units to be compared more effectively. Using large units may be misleading because there may be variables within the area of the unit. The Choropleth map to the left shows population per square mile in the Appalachians.

Saturday, June 21, 2008

Remote Sensing


EAARL DEM Image overlay of the Dry Tortugas National Park showing submerged topography using lidar. NASA's Experimental Advanced Airborne Research Lidar (EAARL) is a raster-scanning green-wavelength water-penetrating lidar. The images are normally taken from a Cessna aircraft using digital multi-spectral color infrared cameras.

http://coastal.er.usgs.gov/remote-sensing/advancedmethods/googleearth.html

Monday, June 16, 2008

Bivariate Choropleth Map


Bivariate Choropleth Maps uses two variables to show the distribution of two sets of data on one map, using two colors or sets of cartographic symbols. These maps are used to analyze or communicate correlations between data. This map combines the variables for Life Expectancy and GNP Per Capita for the African continent in 1989.