A Population Profile, or Population Pyramid, shows sex and age distributions for a determined area, such as a country or region, at a specific period of time. These graphs are useful in understanding the demographic transition of a geographical area. Thin patterns show low fertility, thick patterns show high fertility. A thin column with a bulbous top shows below replacement level fertility. A significant imbalance between the two sides which indicate sex of population may indicate war, in which there is a reduction of men, or infanticide of girls in places like China where there is strict population control along with a desire for male offspring. The pyramid above is for Ethiopia in 2005. The rapidly diminishing pyramid indicates both a high fertility and mortality rate for this country.
Monday, June 30, 2008
Population Profile
A Population Profile, or Population Pyramid, shows sex and age distributions for a determined area, such as a country or region, at a specific period of time. These graphs are useful in understanding the demographic transition of a geographical area. Thin patterns show low fertility, thick patterns show high fertility. A thin column with a bulbous top shows below replacement level fertility. A significant imbalance between the two sides which indicate sex of population may indicate war, in which there is a reduction of men, or infanticide of girls in places like China where there is strict population control along with a desire for male offspring. The pyramid above is for Ethiopia in 2005. The rapidly diminishing pyramid indicates both a high fertility and mortality rate for this country.
Sunday, June 29, 2008
Scatterplot
A Scatterplot uses Cartesian coordinates to graph two variables for a data set. The data is graphed using points, the independent variable plotted along the horizontal axis and the dependent variable along the vertical axis. This kind of visualization is useful for examining correlations. When both variables increase, there is a positive relationship and when one increases and the other decreases, there is a negative one. A line is sometimes included on a scatterplot to indicate the trend of the data, a close fit between this trend line and the points indicates a correlation. This scatterplot plots the FIFA ranking of national soccer teams against their respective countries GNP per capita.
Index Value Plot
An Index Value Plot is a geovisualization that plots an index value rather than an absolute number. An index value is determined and then the values for subsequent periods are divided by the initial average and multiplied by 100, so that all of the plots values are relative to the index value. A common index used in economics is the market basket known as the basket of consumer goods, used to define the Consumer Price Index. The accompanying index value plot indexes home values using a benchmark value from 1890 and factoring out inflation. It shows the high of the housing value boom in the early years of the 21st century.
Saturday, June 28, 2008
Accululated Line Graph (Lorenz Curve)
An Accumulated Line Graph or Lorenz Curve is a type of geovisualization that graphically represents cumulative distribution. It is frequently used in economics to show inequality in wealth or size. It is made by plotting the cumulative distribution of the variable against the cumulative frequency distribution of the individuals that possess the variable. This Accumulation plot is the Lorenz curve for Household Income and Expenditures in the years 2002-2003 for the Maldives, an island nation in the Indian Ocean.
Thursday, June 26, 2008
Bilateral Graph
Graphs can be Bilateral, based upon two data series, in order to compare two related variables. Bilateral Graphs can be of varying types, including bar and line. Often in bilateral bar graphs one data series is measured up or to the right, while the other is measured downwards or to the left. Bilateral graphs can show negative and are frequently used to represent how an increase in one data series cause either a decline in another or an accompanying rise. The bilateral line graph above shows the relationship between gas prices and consumer spending in the US for most of 2007.
Tuesday, June 24, 2008
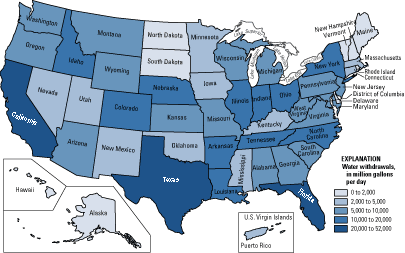
Nominal Area Choropleth
Monday, June 23, 2008
Subscribe to:
Posts (Atom)