skip to main | skip to sidebar

Monday, June 16, 2008

Univariate Choropleth Map


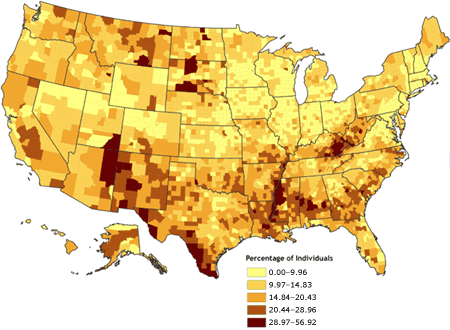
Univariate Choropleth Maps are simple choropleth maps which deal with one subject or data set. The accompanying map uses one variable, that of the percentage of Americans living in poverty, by county in 2000, as its basis. Data are classified by a natural breaks algorithm.
Posted by MB at 6:29 AM

No comments:

Post a Comment

Newer Post Older Post Home
Subscribe to: Post Comments (Atom)

Map Catalogue

Blog Archive

  • ▼  2008 (56)
    • ►  July (10)
    • ▼  June (28)
      • Population Profile
      • Scatterplot
      • Index Value Plot
      • Accululated Line Graph (Lorenz Curve)
      • Bilateral Graph
      • Nominal Area Choropleth
      • Unstandardized Choropleth Map
      • Standardized Choropleth Map
      • Remote Sensing
      • Bivariate Choropleth Map
      • Univariate Choropleth Map
      • Unclassed Choropleth Map
      • Classed Choropleth Map
      • Range-Graded Proportional Circle Map
      • Continuously Variable Proportional Circle Map
      • DOQQs
      • DEM
      • DLG
      • Isopachs
      • DRG
      • Isopleths
      • Isohyets
      • Isotachs
      • Isobars
      • LIDAR
      • Doppler Radar
      • Black and White Aerial Photography
      • Infrared Aerial Photograph
    • ►  May (18)

About Me

MB
View my complete profile